Staff Utilization
Know exactly how every person's hours turn into revenue
Practice Ledger tracks utilization, billable hours and revenue per person as time is logged — then the AI Workforce Optimizer tells you where capacity is being wasted. Built for CPA & consulting firms that manage 10 to 500 people.
- Target utilization
- 75–85%
- Time to a firm-wide view
- Under 1 min
- Recoverable hours found
- 3–6 / person / wk
- Free trial
- 30 days
Tracked daily against each role's target
No spreadsheet exports
Typical first-quarter result
No credit card required
Watch a partner analyze his team
A short clip from a live firm: sorting the staff list by utilization, opening a profile and deciding how to reallocate work for the coming week.
Everything in the utilization module
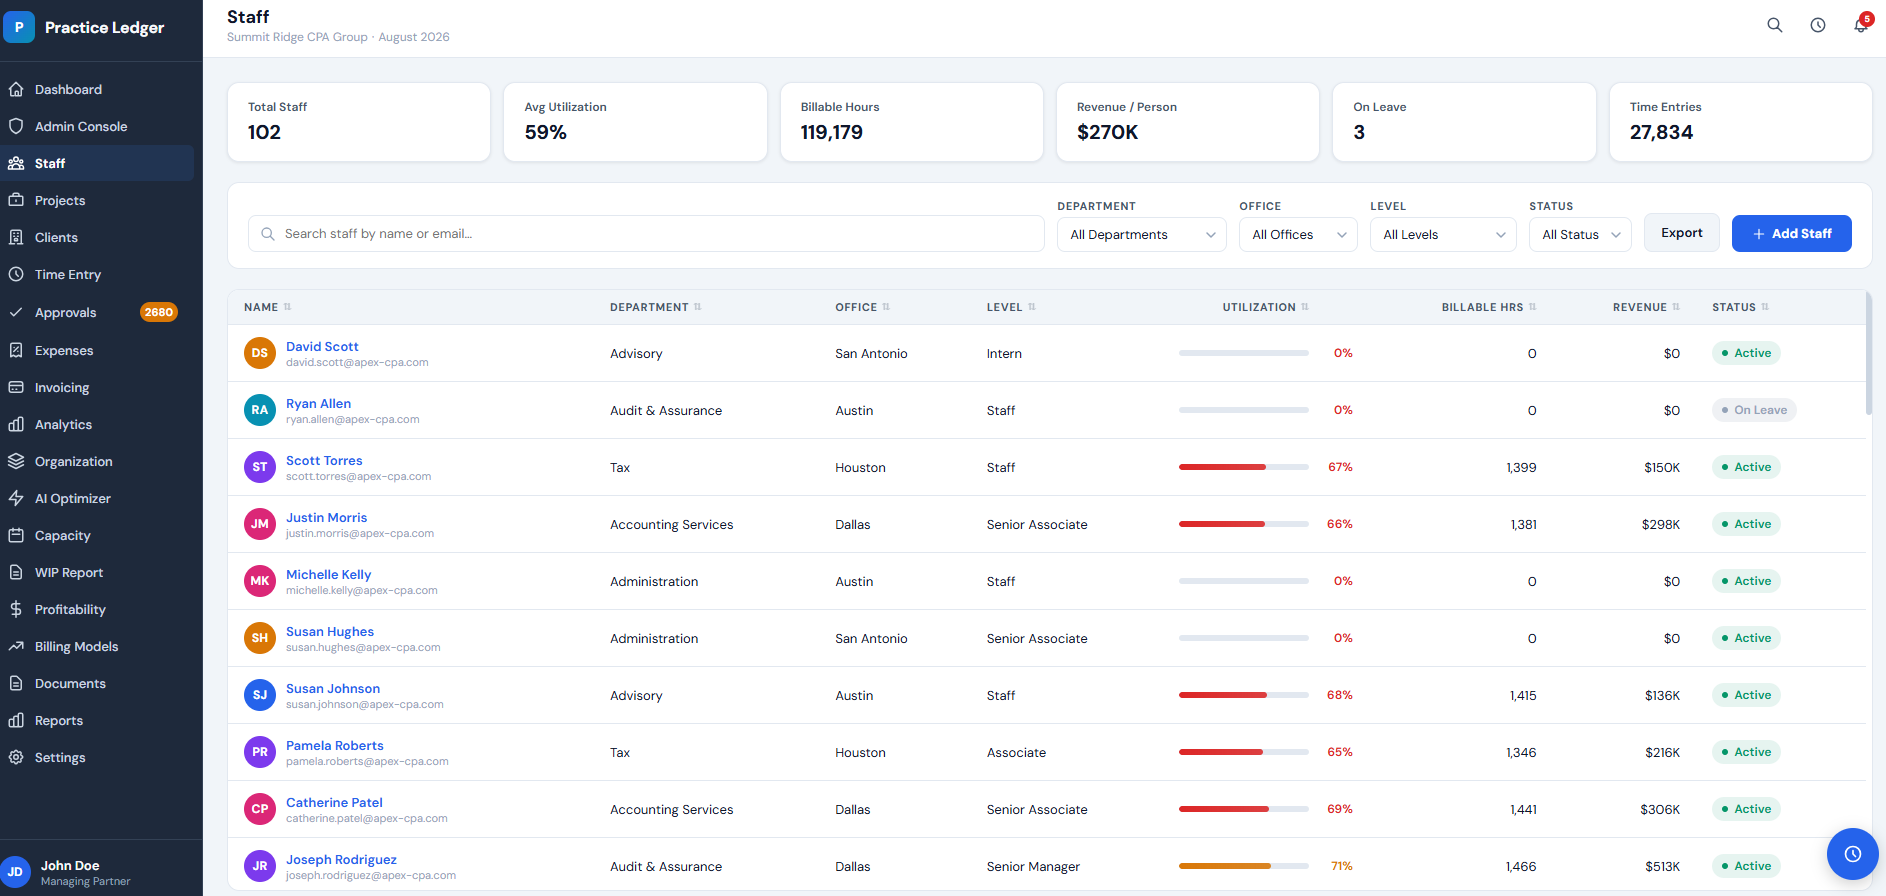
Live utilization by person
Utilization bars for every staff member, updated as time is entered — not two weeks after month end.
Billable vs non-billable hours
Split logged hours by billable, non-billable, admin and PTO so capacity conversations use real numbers.
Revenue per person
See standard rate, realized rate and revenue generated per person, per engagement and per service line.
Peer and team comparison
Benchmark each person against their peer group, department and prior periods to spot outliers early.
AI Workforce Optimizer
Suggests reassignments and staffing plans from open engagements, deadlines and current capacity. Included in every plan.
Approval-ready timesheets
Managers review, adjust and approve time from the same screen the utilization numbers are built from.
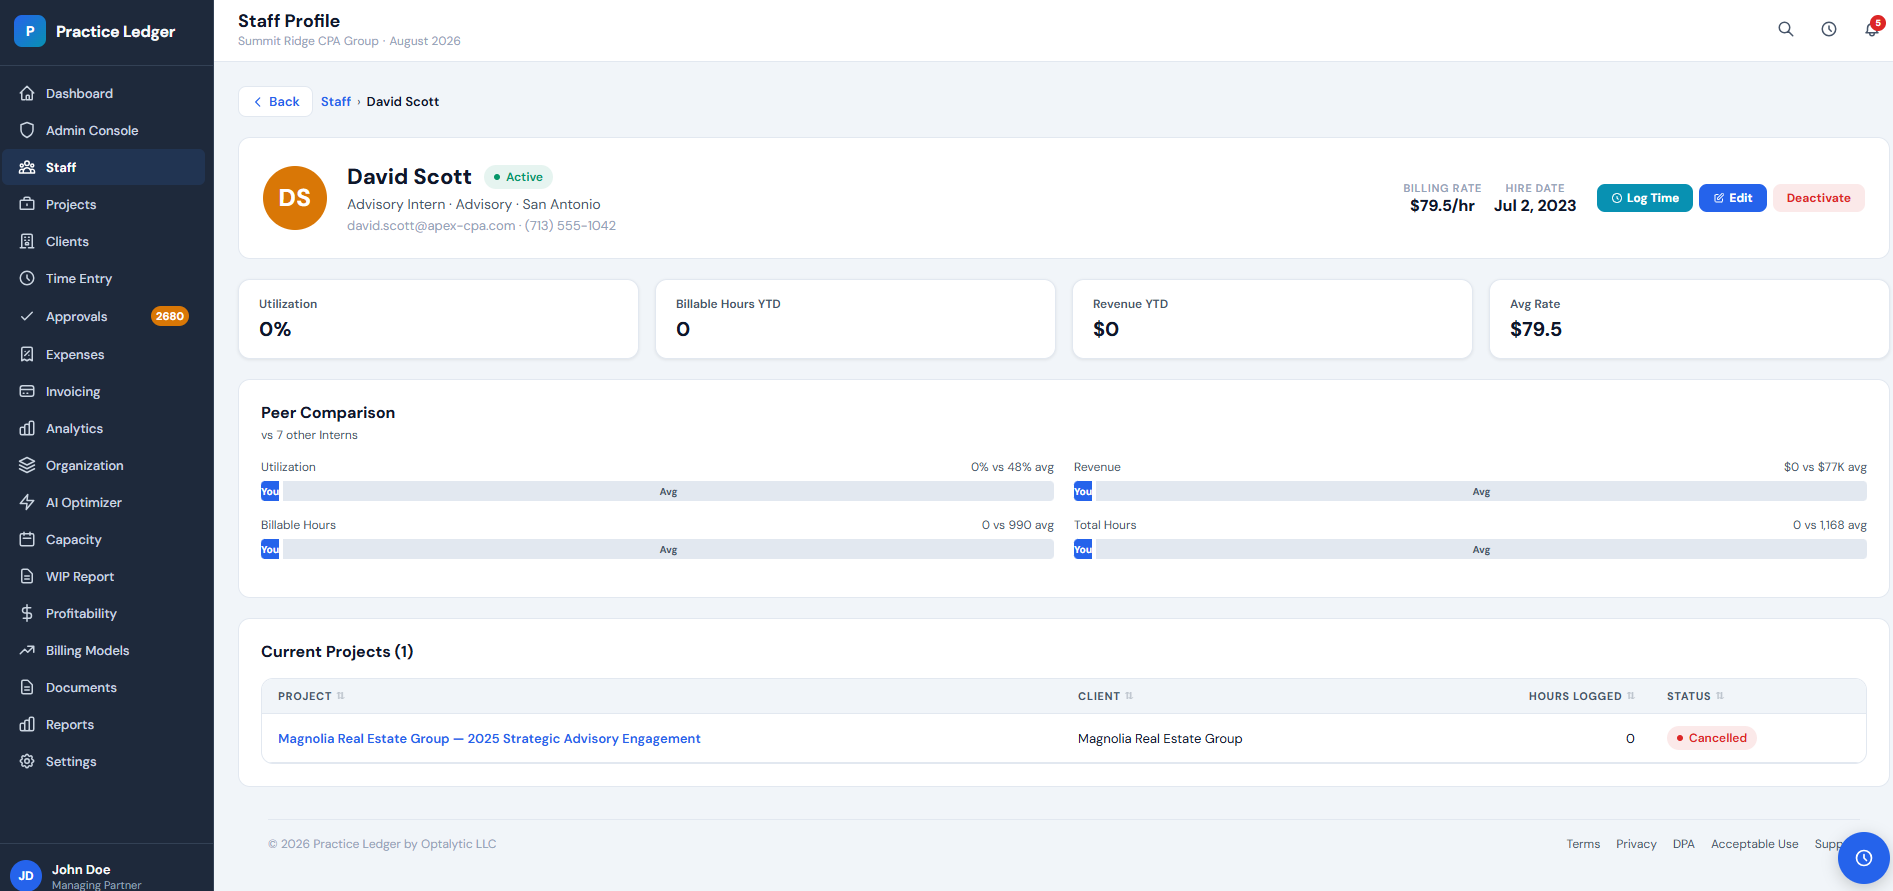
Drill into any staff profile
One click from the list opens the person: utilization trend, billable hours by month, current engagements, standard and realized rate, YTD revenue and how they compare to their peer group.
- Monthly billable vs non-billable trend
- Engagements they are staffed on right now
- Rate, realization and YTD revenue generated
- Peer comparison against the same level and department
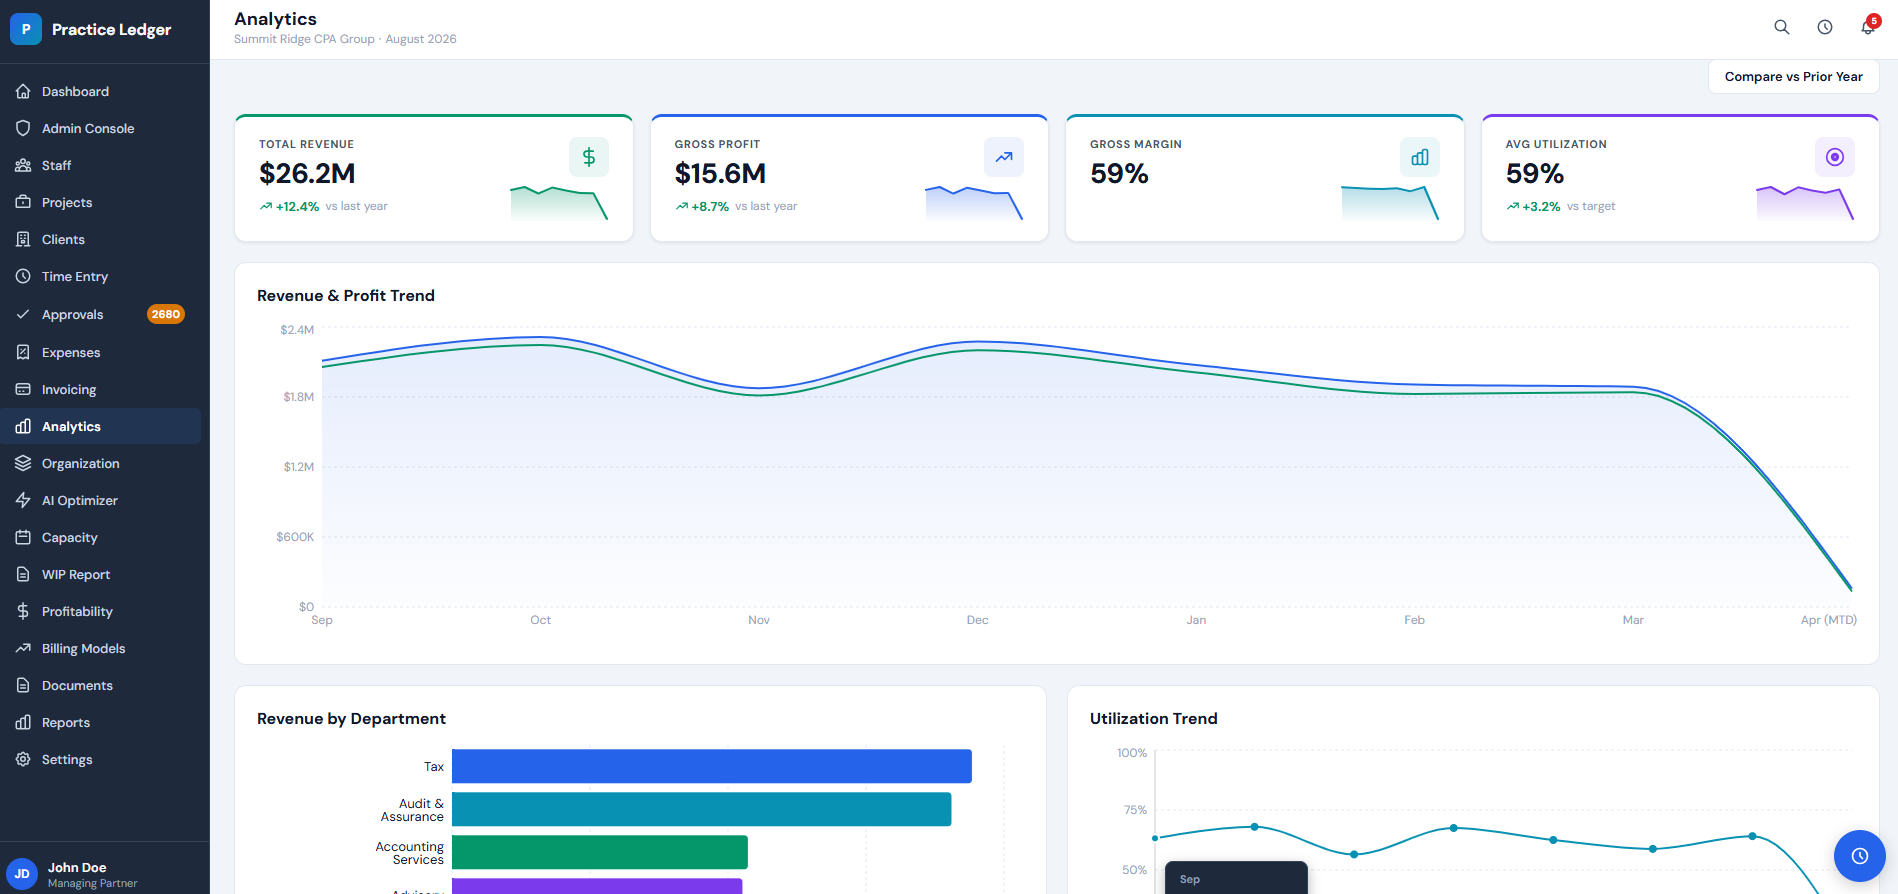
Roll utilization up to firm performance
The same hours feed revenue, WIP and profitability, so a utilization gap shows up as a margin number by department and service line — not as a separate spreadsheet nobody reconciles.
See the full buyer's guide →Improved profitability: an illustrative estimate
A worked example of what recovering administrative time can be worth for a 40-person firm, based on the assumptions below.
Illustrative ROI assumptions
- Employees
- 40
- Administrative hours per employee per week
- 2
- Loaded hourly labor cost
- $55
- Administrative time reduction assumption
- 25%
- Monthly software cost
- $1,800
Improved profitability estimate
- Monthly hours recovered
- 87
- Gross monthly labor capacity value
- $4,763
- Net monthly value after software cost
- $2,963
Illustrative estimates only; validate assumptions with customer data.
What's included by plan
Professional $149 per user/month · Enterprise $249 per user/month. Annual billing saves 20% ($119 and $199). Professional starts at 5 seats, Enterprise at 10.
| Capability | Professional | Enterprise |
|---|---|---|
| Staff utilization dashboard | ||
| Billable hours & revenue per person | ||
| Individual staff profiles & peer comparison | ||
| AI Workforce Optimizer | ||
| Custom report builder | ||
| Native mobile time entry | ||
| Dedicated onboarding assistance | ||
| Multi-firm / organization rollups | ||
| Priority SLA (4-hour response) |
Questions firms ask
How is utilization calculated?
Billable hours divided by available hours for the period, using each role's target so seniors and staff are measured fairly. You can view it weekly, monthly, quarterly or year to date.
Do partners and managers see the same numbers?
Yes — everyone reads the same ledger. Role-based access controls who can see firm-wide figures versus their own team.
What does the AI Workforce Optimizer do?
It reads open engagements, deadlines, skills and current capacity, then recommends who should take on what. It is included in both Professional and Enterprise plans at no extra cost.
How much does it cost?
Professional is $149 per user/month and Enterprise is $249 per user/month, with 20% off when billed annually ($119 and $199). Professional starts at 5 seats, Enterprise at 10.
Can we try it with our own data?
Start free for 30 days with no credit card. Data import and migration from legacy systems such as Practice Engine is included.
Start your 30-day free trial
Tell us about your firm and we'll open your trial workspace — no credit card required. Data import from your current system is included.
Keep comparing
Most firms shortlist three platforms. These pages cover the rest of the comparison.
Buyer's guide: best accounting practice management software
The six evaluation criteria, the demo questions to ask, and how to score every vendor.
Read moreTime, expense and billing software
Time entry, expense capture, WIP, invoicing and realization in one firm ledger.
Read morePricing and savings calculator
Seat pricing, annual discounts, and an ROI calculator for your headcount and billing rates.
Read more